

The Baking Soda Price Trend moved higher across most global markets during Q2 2026, with the strongest increases seen in parts of Asia and Europe. Rising energy costs, higher logistics expenses, supply chain pressure, and the wider impact of geopolitical tensions were the main factors behind the increase. At the same time, demand from food processing, pharmaceuticals, chemicals, and industrial users remained fairly steady. This combination of higher costs and stable demand kept Baking Soda Prices supported across many regions during the quarter.
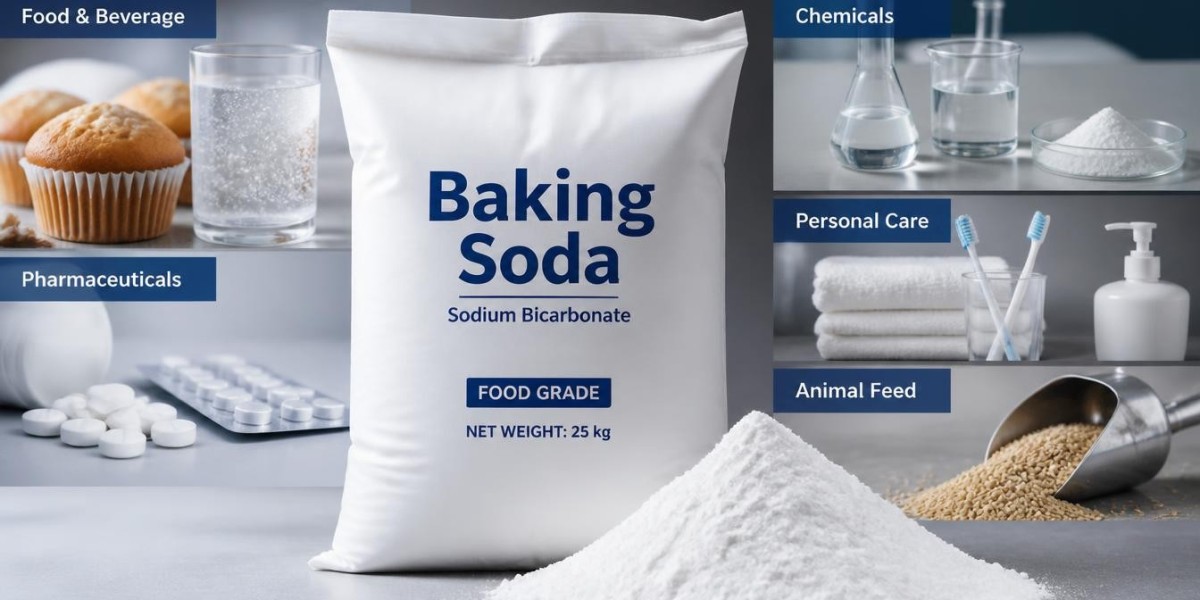
Baking soda, also known as sodium bicarbonate, is used in many everyday and industrial applications. It is found in food processing, baking, pharmaceuticals, animal feed, chemicals, water treatment, and several manufacturing processes. Because of its broad usage, changes in production costs, transportation expenses, energy prices, and international trade can have a direct effect on its market value.
? ? ? Please Submit Your Query for Baking Soda Price Trend, demand-supply, suppliers, market analysis: https://www.price-watch.ai/book-a-demo/
Global Baking Soda Price Trend in Q2 2026
The second quarter of 2026 showed a generally upward movement in baking soda prices. However, the increase was not the same in every market. Some regions experienced relatively moderate gains, while technical-grade markets in Thailand and Singapore recorded much stronger increases.
The largest quarterly increase among the markets covered was seen in Thailand, where technical-grade prices rose by around 26%. Singapore followed with an increase of approximately 22%. Belgium, Turkey, Spain, India, and Indonesia also recorded noticeable gains.
On the other hand, the United States, Canada, and Mexico experienced more moderate increases of around 4% during the quarter. South Africa recorded the smallest quarterly rise among the markets covered, at approximately 3%.
This regional difference is important because Baking soda Prices are influenced not only by global supply and demand but also by local production costs, freight rates, import dependence, product grade, and domestic availability.
What Drove Baking Soda Prices Higher?
One of the main factors affecting the Q2 2026 market was the growing pressure on energy and logistics costs connected with geopolitical tensions. Higher energy costs can increase the expenses involved in manufacturing chemicals, while transportation disruptions can raise the cost of moving material between production centers and consuming markets.
For exporters, higher production and freight costs can lead to higher FOB prices. Importing countries can then experience additional increases when these higher origin prices are combined with freight and handling costs.
Demand was another important factor. Food and pharmaceutical buyers continued to purchase baking soda steadily, while industrial users maintained demand for technical-grade material. When demand remains stable at the same time that supply-side costs are rising, sellers generally have more room to maintain or increase prices.
China Baking Soda Prices
China remained an important reference point for several Asian import markets during Q2 2026. Food-grade sodium bicarbonate prices on an FOB Shanghai basis increased by around 8% during the quarter.
Higher energy and production costs supported the increase, while demand from food processing and pharmaceutical buyers remained steady. However, the market changed direction slightly in June.
During June, Chinese baking soda prices declined by around 2%. Domestic supply became more readily available, putting downward pressure on export prices. Buyers also became more cautious about procurement as the Chinese market appeared relatively well supplied.
This shows why the Baking Soda Price Trend can change even when broader international costs remain high. Local supply availability can sometimes temporarily outweigh external cost pressures.
Turkey Baking Soda Price Trend
Turkey recorded one of the stronger increases during Q2 2026. Food-grade baking soda prices rose by around 15% during the quarter.
Higher regional logistics and energy costs increased production expenses, while tighter feedstock availability added another layer of pressure. Demand from food and pharmaceutical sectors remained steady, allowing prices to stay elevated.
June brought another increase of approximately 4%. Continued geopolitical uncertainty and elevated production costs supported firmer export pricing.
Singapore and Thailand See Strongest Increases
Technical-grade markets in Singapore and Thailand experienced the most significant price increases during Q2.
In Singapore, prices increased by around 22% during the quarter. Strong demand for technical-grade material combined with supply chain pressure and higher production and logistics costs. In June alone, prices increased another 7%.
Thailand recorded an even stronger quarterly increase of approximately 26%. Robust industrial demand for technical-grade baking soda placed additional pressure on available supply. At the same time, domestic production and logistics costs increased sharply.
Prices in Thailand rose another 8% in June, making the country the strongest-performing market among those covered in the Q2 2026 data.
Baking Soda Prices in the United States
The United States recorded a more moderate increase. Food-grade baking soda prices increased by around 4% during Q2.
Higher energy costs and supply chain uncertainty increased domestic manufacturing expenses. However, steady demand from food, pharmaceutical, and chemical users provided support to the market.
In June, prices increased another 3%. This suggests that cost pressure continued to move gradually through the domestic market rather than creating a sudden price jump.
India Baking Soda Price Trend
India recorded an increase of approximately 11% in Q2 2026. The Indian market was affected by higher energy expenses, inland transportation costs, and production costs.
Transportation was particularly important because higher logistics expenses directly affected the economics of domestic supply. At the same time, food, pharmaceutical, and chemical demand remained firm.
In June, prices increased by around 1%. The smaller monthly increase suggests that some of the stronger quarterly price movement had already been reflected in the market by the end of the quarter.
European Market: Spain and Belgium
European markets also experienced noticeable increases.
Spain recorded a quarterly increase of around 14% for technical-grade baking soda. Higher European energy and logistics costs contributed to increased procurement expenses. Prices rose another 5% in June as supply chain costs remained elevated.
Belgium recorded an even stronger increase of approximately 16%. Higher energy expenses added to already elevated production costs in the chemical manufacturing sector. Regional availability also became tighter, supporting the upward movement.
Belgian prices increased another 4% in June, indicating that cost pressure remained present toward the end of the quarter.
Asian Import Markets
Several Asian countries that rely on imports from China also experienced price increases.
South Korea recorded an increase of around 7% during Q2. The rise largely reflected higher Chinese FOB prices and related logistics costs. However, June saw a small correction of approximately 1% as Chinese export prices softened.
Indonesia recorded a quarterly increase of around 10%. Higher Chinese FOB prices were combined with increased freight costs, resulting in stronger import values. Prices rose another 2% in June.
Australia recorded a quarterly increase of around 9%. As an import-dependent market, Australian buyers were exposed to both higher Chinese origin prices and rising freight costs. Prices increased another 1% in June.
South Africa, Canada, and Mexico
South Africa experienced a relatively small quarterly increase of around 3%. Higher Chinese FOB prices were passed through only partially because local logistics and trade flow conditions moderated the impact. In June, prices declined by around 4%, reflecting softer Chinese export pricing.
Canada and Mexico both recorded increases of approximately 4% during Q2. Both markets tracked the higher United States FOB trend.
In Canada, stable freight conditions allowed the higher US origin costs to pass through relatively smoothly. Prices increased another 2% in June.
Mexico also saw another 2% increase in June, supported by continued US price firmness and steady demand from food processing and chemical users.
Baking Soda Price Chart and Regional Differences
A Baking Soda Price Chart for Q2 2026 would show a clear difference between markets. Thailand and Singapore would stand out with the largest quarterly gains, while Turkey, Belgium, Spain, India, and Indonesia would occupy the middle range.
The United States, Canada, Mexico, and South Africa would show comparatively smaller movements.
This regional pattern highlights an important point: there is no single global baking soda price. Prices vary according to grade, location, production conditions, freight costs, trade routes, and local supply-demand balances.
Baking Soda Price Index
The Baking Soda Price Index remained generally supported during Q2 2026 because the overall cost environment was still firm. Energy prices, logistics expenses, and geopolitical uncertainty created an upward cost base across many markets.
However, the index should not be viewed as a uniform indicator for every country. China and South Africa, for example, experienced corrections in June, while Thailand and Singapore continued to rise strongly.
The regional differences suggest that market participants should consider both the overall index direction and individual country-level conditions when assessing pricing.
Baking Soda Price Forecast: What to Expect Next?
Looking ahead, the short-term Baking Soda Price Forecast will likely depend on several key factors.
First, energy costs will remain important because they influence chemical production expenses. Second, freight and logistics conditions will affect import-dependent markets. Third, the availability of raw materials and finished product will determine whether supply remains tight or becomes more comfortable.
Demand will also play a major role. Food, pharmaceutical, chemical, and industrial users are expected to remain important sources of consumption. If demand stays steady while production and transportation costs remain elevated, prices could continue to receive support.
At the same time, the June correction in China and South Africa shows that prices can move lower when supply becomes more available or when buyers reduce procurement activity. Therefore, the next phase of the market may remain mixed rather than moving in one direction everywhere.
? ? ? Please Submit Your Query for Baking Soda Price Trend, demand-supply, suppliers, market analysis: https://www.price-watch.ai/book-a-demo/
About Price Watch™
Price Watch™ is an India-based, independent raw material price reporting agency that provides real-time price forecasts and data-driven insights into global raw material markets. Price Watch™ specializes in tracking raw material prices, analyzing market trends, and delivering timely updates on plant shutdowns, supply disruptions, capacity expansions, and demand-supply dynamics.
The Price Watch™ platform empowers manufacturers, traders, and procurement professionals to make faster, smarter decisions. Leveraging AI-powered forecasting and over a decade of historical data, Price Watch™ transforms market volatility into actionable opportunity.
Futura Tech Park,
C Block, 8th floor 334,
Old Mahabalipuram Road,
Sholinganallur, Chennai, Tamil Nadu, Pincode - 600119.
????????: https://www.linkedin.com/company/price-watch-ai/
????????: https://www.facebook.com/people//61568490385598/
???????: Price Watch™ (@pricewatchai) on X
???????: https://www.price-watch.ai/