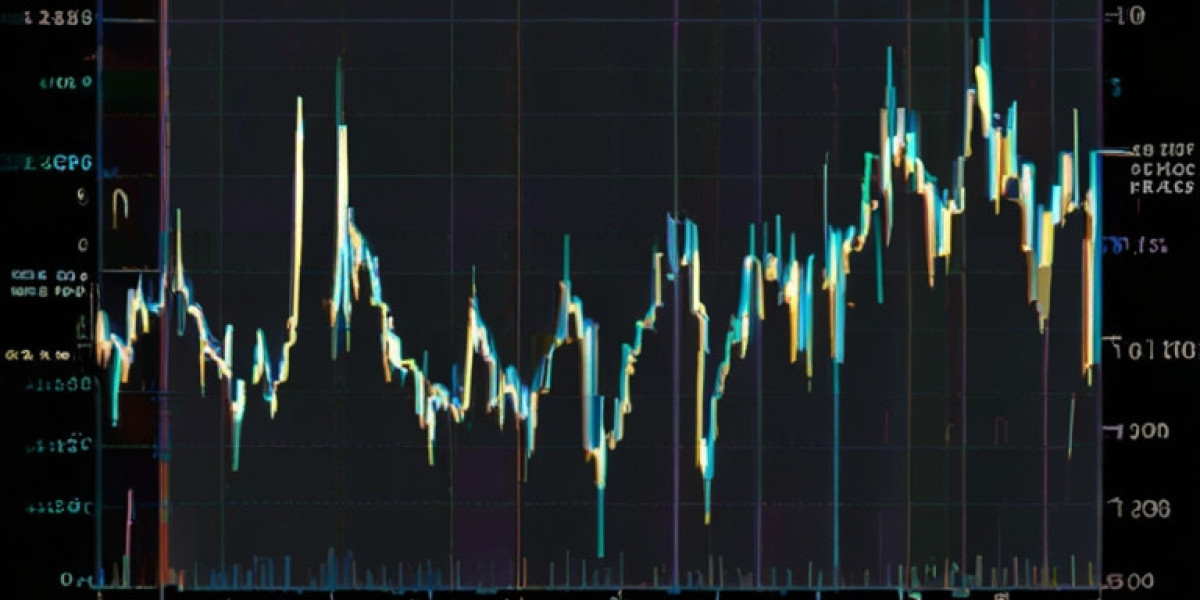
North America Bromine Prices Movement Last Quarter:
Bromine Prices in the United States:
Product | Category | Price |
Bromine | Chemical | 2333 USD/MT |
In the second quarter of 2024, the Bromine Price Chart for the U.S. experienced a notable increase, with prices reaching 2,333 USD/MT in June. This surge was primarily driven by a spike in demand from the flame-retardant industry. Additionally, the supply of bromine became tighter as imports decreased due to geopolitical tensions, further intensifying the price pressures. To complicate things, rising transportation and freight costs added extra strain to the supply chain, pushing prices even higher. The Bromine Price Chart clearly shows how these factors converged to create a bullish market environment, keeping bromine prices relatively stable compared to the previous quarter. This trend underscores the strong connection between supply constraints, industrial demand, and external market influences in shaping bromine price movements in the U.S. market.
Note: The analysis can be tailored to align with the customer's specific needs.
APAC Bromine Prices Movement Last Quarter:
Bromine Prices in China:
Product | Category | Price |
Bromine | Chemical | 2767 USD/MT |
On the other hand, in Q2 2024, the Bromine Price Index in China saw a significant jump, hitting 2,767 USD/MT by the end of June. This increase was largely attributed to supply limitations and growing industrial demand. The market was quite volatile, with prices soaring compared to the previous year but dipping about the last quarter, highlighting the unpredictable nature of bromine pricing. The Bromine Price Index illustrates how supply constraints played a crucial role in driving prices up, as limited availability coupled with strong industrial consumption exerted pressure on the market. This fluctuation emphasizes the delicate balance between supply shortages and rising demand, creating a highly dynamic pricing environment throughout the quarter.
Regional Analysis: The price analysis can be extended to provide detailed boron price information for the following list of countries.
China, India, Indonesia, Pakistan, Bangladesh, Japan, Philippines, Vietnam, Thailand, South Korea, Malaysia, Nepal, Taiwan, Sri Lanka, Hongkong, Singapore, Australia, and New Zealand, among other Asian countries.
MEA Bromine Prices Movement Last Quarter:
Bromine Prices in UAE:
Product | Category | Price |
Bromine | Chemical | 2471 USD/MT |
In the second quarter of 2024, the Bromine Price Chart for the UAE revealed a significant uptick, with prices reaching 2,471 USD/MT by the end of June. This increase was largely driven by strong demand from local industries, particularly in construction, where various infrastructure projects ramped up bromine consumption. Additionally, supply chain disruptions and rising freight costs put extra pressure on prices. Despite the usual seasonal fluctuations and ongoing challenges in the regional market, the Bromine Price Chart clearly shows how a combination of increased industrial activity and logistical hurdles created a robust demand for bromine in the UAE during this period.
Regional Analysis: The price analysis can be extended to provide detailed base oil price information for the following list of countries.
Saudi Arabia, UAE, Israel, Iran, South Africa, Nigeria, Oman, Kuwait, Qatar, Iraq, Egypt, Algeria, and Morocco, among other Middle Eastern and African countries.
Factors Affecting Bromine Prices and Demand:
Several factors influence Bromine Prices and Demand, shaping market trends globally. A major driver is industrial demand, especially from sectors like flame retardants, pharmaceuticals, water treatment, and oil drilling, where bromine plays a crucial role. The supply chain dynamics are equally important; any hiccups in production, transportation costs, or geopolitical issues can restrict availability and push prices higher.
Furthermore, the costs of raw materials, particularly from bromine-rich sources like brine pools and seawater, have a significant impact on overall pricing trends. Environmental regulations and sustainability initiatives can also affect bromine production, sometimes resulting in supply shortages. Currency fluctuations and global economic conditions contribute to market volatility as well. All these elements together shape Bromine Prices and Demand, influencing both short-term price shifts and the long-term stability of the market.
Speak To An Analyst: https://www.imarcgroup.com/request?type=report&id=22322&flag=C
Key Coverage:
- Market Analysis
- Market Breakup by Region
- Demand Supply Analysis by Type
- Demand Supply Analysis by Application
- Demand Supply Analysis of Raw Materials
- Price Analysis
- Spot Prices by Major Ports
- Price Breakup
- Price Trends by Region
- Factors Influencing the Price Trends
- Market Drivers, Restraints, and Opportunities
- Competitive Landscape
- Recent Developments
- Global Event Analysis
How the IMARC Pricing Database Can Help
The latest IMARC Group study, “Bromine Prices, Trend, Chart, Demand, Market Analysis, News, Historical and Forecast Data 2024 Edition,” presents a detailed analysis of the Bromine price trend, offering key insights into global Bromine market dynamics. This report includes comprehensive price charts, which trace historical data and highlight major shifts in the market.
The analysis delves into the factors driving these trends, including raw material costs, production fluctuations, and geopolitical influences. Moreover, the report examines Bromine's demand, illustrating how consumer behavior and industrial needs affect overall market dynamics. By exploring the intricate relationship between supply and demand, the price report uncovers critical factors influencing current and future prices.
About Us:
IMARC Group is a global management consulting firm that provides a comprehensive suite of services to support market entry and expansion efforts. The company offers detailed market assessments, feasibility studies, regulatory approvals, licensing support, and pricing analysis, including spot pricing and regional price trends. Its expertise spans demand-supply analysis and regional insights covering Asia-Pacific, Europe, North America, Latin America, the Middle East, and Africa. IMARC also specializes in competitive landscape evaluations, profiling key market players, and conducting research into market drivers, restraints, and opportunities. IMARC’s data-driven approach helps businesses navigate complex markets with precision and confidence.
Contact us:
IMARC Group
134 N 4th St. Brooklyn, NY 11249, USA
Email: sales@imarcgroup.com
Tel No: (D) +91 120 433 0800
United States: +1-631-791-1145


